2021-11: The plan below didn't really pan out and Tiki still uses more than one lib for charts. Some work is planned in coming months, and we'll revisit this issue. And look at
https://github.com/apache/echarts
Conclusion for the Tiki19+ development roadmap:
- All efforts will go towards Plotly
- All direct alternatives (and their underlying components) in Tiki such as PluginChartJS, PluginGDgraph and PluginChart will be marked as deprecated without a scheduled version to remove (so new users avoid them, but current users can still use)
- All charts in Tiki will progressively be moved to Plot.ly. Once everything can be done via Plot.ly, a Tiki version number will be set for removal of the other options. This will be in a post-LTS version, giving ample time for end users to switch to new method.
- Indirect alternatives which connect to a 3rd party system, like PluginR, are unaffected.
- As Plot.ly is built on D3.js, we'll end up with D3 anyways. For needs that go beyond Plot.ly, we'll explore to use d3.js in a more native way.
The soonest PluginChartJS and PluginGDgraph would removed would be Tiki 22. So users could stay with Tiki 21.x for 5 years. I did indicate on PluginChartJS that is was experimental so it should be no surprise.
Reasons: In terms of charts that we can bundle within Tiki (and not rely on external services or a 3rd party app like R), there are two excellent options. It is better to converge our energies on one. Why Plot.ly instead of Chart.js? Amna summed it up:
If we have to keep one then plot.ly, since it can support both basic and advanced chart types, already being integrated with trackers and mPDF and used by clients. We can work over plot.ly to add basic chart types and make it more user friendly, integrate with pluginList and add animations to make it cool.
As of 2016-12, there are duplicate ways to do Data Visualization (dev) in Tiki. See: Visualization (doc)
There are several ways to make even a simple pie chart. And some more libs are considered for integration. Usually, the Tiki community converges / concentrates its efforts on a small number of powerful tools. If there is duplication, it's because one approach is easy / out-of-the-box, and another is very powerful (ex.: PluginCustomSearch vs PluginTrackerFilter) This page is to discuss / debate the ideal roadmap.
- What to integrate
- What to use for what use case
- What to deprecate
Here is related discussion on the Tiki developer mailing list: https://tiki.org/forumthread62514
Contents of this page:
Major options
The major options are R, Kibana, plotly.js, D3.js and Chart.js
1.1.1. R
Pros
- Already well developed within the Tiki ecosystem: https://r.tiki.org/
- It's more than just charts: it can do dashboards, complex tables, calculations, htmlwidgets, book creation, markdown conversion, etc.
- it has exponential growth of packages: plot.ly, many d3 wrappers, scientific data from/for any discipline, ...
Cons
- Adds a dependency
- Does not run on shared hosting
1.1.2. Kibana
Pros
Cons
- Relies on Elasticsearch
- Does not run on shared hosting
- Missing some charts already requested in some projects like boxplots.
1.1.3. plotly.js
Pros
Cons
1.1.4. D3.js
Pros
Cons
1.1.5. Chart.js
Uses Canvas (and not SVG)
Pros
Cons
1.1.6. ApexCharts
1.2. Minor options
Shouldn't we improve the current charting and visualization capabilities the we (more-or-less) have already in Tiki?
1.2.1. Raphael.js in Spreadsheets
Spreadsheets
They use raphael.js (http://dmitrybaranovskiy.github.io/raphael/), but some love is needed to fix some chart display & usability bugs. They look like "low hanging fruit" to some of us, specially for the basic needs of fairly simple charts, and PluginChart is indeed needed to work again to visualize those charts from tiki spreadsheets, and ideally, charts from any new lib intergrated (besides, or instead, of raphael.js in tiki spreadsheets).
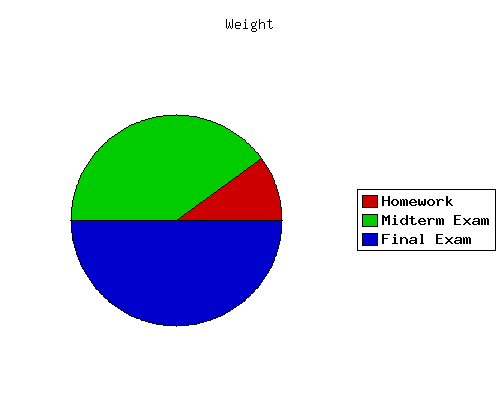
Parameters for the pie chart through tiki-graph_sheet.php?sheetId=1&graphic=PieChartGraphic&width=500&height=400&renderer=PNG

Resulting pie chart
1.3. Other research
Slides available: https://goo.gl/77dwl5
1.4. Plot.ly vs Chart.js
The two realistic contenders for charts in Tiki, without an external dependency (like R) are:
Note that in both case, using them server side is pretty heavy, might be an issue on shared hosting.
See also:
https://www.openhub.net/p/_compare?project_0=Chart-js&project_1=plotly.js
http://www.chartjs.org/docs/latest/notes/comparison.html
https://blog.sicara.com/compare-best-javascript-chart-libraries-2017-89fbe8cb112d#66bc
https://source.opennews.org/articles/what-i-learned-recreating-one-chart-using-24-tools/
1.5. Related pages
Alias names for this page:
DatavisConvergence
^ 2021-11: The plan below didn't really pan out and Tiki still uses more than one lib for charts. Some work is planned in coming months, and we'll revisit this issue. And look at https://github.com/apache/echarts^
^
Conclusion for the ((Tiki19))+ development roadmap:
* All efforts will go towards ((Plotly))
* All direct alternatives (and their underlying components) in Tiki such as ((doc:PluginChartJS)), ((doc:PluginGDgraph)) and ((doc:PluginChart)) will be marked as deprecated without a scheduled version to remove (so new users avoid them, but current users can still use)
* All charts in Tiki will progressively be moved to Plot.ly. Once everything can be done via Plot.ly, a Tiki version number will be set for removal of the other options. This will be in a post-LTS version, giving ample time for end users to switch to new method.
* Indirect alternatives which connect to a 3rd party system, like ((doc:PluginR)), are unaffected.
* As Plot.ly is built on D3.js, we'll end up with D3 anyways. For needs that go beyond Plot.ly, we'll explore to [item5155|use d3.js in a more native way].
The soonest ((doc:PluginChartJS)) and ((doc:PluginGDgraph)) would removed would be Tiki 22. So users could stay with Tiki 21.x for 5 years. I did indicate on ((doc:PluginChartJS)) that is was experimental so it should be no surprise. {sign user="marclaporte" datetime="2018-06-03T18:39:24+00:00"}
Reasons: In terms of charts that we can bundle within Tiki (and not rely on external services or a 3rd party app like R), there are two excellent options. It is better to converge our energies on one. Why Plot.ly instead of Chart.js? Amna summed it up:
{QUOTE(replyto="Amna Bilal")} If we have to keep one then plot.ly, since it can support both basic and advanced chart types, already being integrated with trackers and mPDF and used by clients. We can work over plot.ly to add basic chart types and make it more user friendly, integrate with pluginList and add animations to make it cool. {QUOTE}
^
As of 2016-12, there are duplicate ways to do ((Data Visualization)) (dev) in Tiki. See: ((doc:Visualization)) (doc)
There are several ways to make even a simple pie chart. And some more libs are considered for integration. Usually, the Tiki community converges / concentrates its efforts on a small number of powerful tools. If there is duplication, it's because one approach is easy / out-of-the-box, and another is very powerful (ex.: PluginCustomSearch vs PluginTrackerFilter) This page is to discuss / debate the ideal roadmap.
* What to integrate
* What to use for what use case
* What to deprecate
Here is related discussion on the Tiki developer mailing list: https://tiki.org/forumthread62514
__Contents of this page__: {maketoc title="" levels="2,3"}
!!# Major options
The major options are R, Kibana, plotly.js, D3.js and Chart.js
!!!# R
Pros
* Already well developed within the Tiki ecosystem: https://r.tiki.org/
* It's more than just charts: it can do dashboards, complex tables, calculations, htmlwidgets, book creation, markdown conversion, etc.
* it has exponential growth of packages: plot.ly, many d3 wrappers, scientific data from/for any discipline, ...
Cons
* Adds a dependency
* Does not run on shared hosting
!!!# Kibana
{HTML()}<script type='text/javascript' src='https://www.openhub.net/p/Kibana/widgets/project_factoids_stats?format=js'></script>{HTML}
Pros
* Tightly integrated with Elasticsearch (which is well integrated with Tiki)
* It's more than just charts: it's a dashboard builder
* We'll soon have a secure and easy way to install and manage Kibana on ClearOS: http://wikisuite.org/How-to-install-Kibana-on-ClearOS
Cons
* Relies on Elasticsearch
* Does not run on shared hosting
* Missing some charts already requested in some projects like boxplots.
!!!# plotly.js
{HTML()}<script type='text/javascript' src='https://www.openhub.net/p/plotly_js/widgets/project_factoids_stats?format=js'></script>{HTML}
Pros
* All in JavaScript, runs on shared hosting
* Uses D3.js
** [https://github.com/plotly/plotly.js/blob/master/README.md|Built on top of d3.js and stack.gl, plotly.js is a high-level, declarative charting library. plotly.js ships with over 20 chart types, including scientific charts, 3D graphs, statistical charts, SVG maps, financial charts, and more.]
* There is a companion Dashboard creator: https://github.com/plotly/dashboards.ly
* Tons of examples on the community site
* Very active project
* A new connector for http://help.plot.ly/database-connectors/elasticsearch/
* Now on Packagist: https://packagist.org/packages/plotly/plotly.js [https://github.com/plotly/plotly.js/issues/1242|Thanks to Marc])
* Generated charts are printable by ((doc:mPDF))
Cons
* Heavy
!!!# D3.js
{HTML()}<script type='text/javascript' src='https://www.openhub.net/p/d3js/widgets/project_factoids_stats?format=js'></script>{HTML}
Pros
* Very powerful
* On Packagist: https://packagist.org/packages/mbostock/d3
* runs on shared hosting
Cons
* Complexity ( and thus, would make sense to use [#plotly.js|Plotly.js] or http://c3js.org/examples.html )
!!!# Chart.js
Uses Canvas (and not SVG)
{HTML()}<script type='text/javascript' src='https://www.openhub.net/p/Chart-js/widgets/project_factoids_stats?format=js'></script>{HTML}
Pros
* Nice UI
* Work started in Tiki -> https://doc.tiki.org/PluginChartJS
* On Packagist: https://packagist.org/packages/nnnick/chartjs
* Runs on shared hosting
* Very active and popular project
* Lightweight
Cons
* Current integration doesn't permit use of existing reports like PluginList) -> https://doc.tiki.org/PluginChartJS
* Only 8 charts: https://github.com/chartjs/Chart.js/tree/master/docs
* Generated charts do not print in ((doc:mPDF)) so external tool to convert is necessary: ((Converting dynamic JavaScript content into static assets))
!!!# ApexCharts
* Started in 2018
* https://apexcharts.com/javascript-charts-comparison/
{HTML()}<script type='text/javascript' src='https://www.openhub.net/p/apexcharts/widgets/project_factoids_stats?format=js'></script>{HTML}
!!# Minor options
Shouldn't we improve the current charting and visualization capabilities the we (more-or-less) have already in Tiki?
!!!# Raphael.js in Spreadsheets
((doc:Spreadsheets))
They use __raphael.js__ ([http://dmitrybaranovskiy.github.io/raphael/]), but some love is needed to fix some chart display & usability bugs. They look like "low hanging fruit" to some of us, specially for the basic needs of fairly simple charts, and ((doc:PluginChart)) is indeed needed to work again to visualize those charts from tiki spreadsheets, and ideally, charts from any new lib intergrated (besides, or instead, of raphael.js in tiki spreadsheets).
^
-= Parameters for the pie chart through tiki-graph_sheet.php?sheetId=1&graphic=PieChartGraphic&width=500&height=400&renderer=PNG =-
{img src="https://doc.tiki.org/img/wiki_up/chart_param_pie.png" width="400"}
-=Resulting pie chart=-
{img src="https://doc.tiki.org/img/wiki_up/chart_pie.png" width="400"}
^
!!# Other research
{youtube movie="qLh_wNbslrI"}
Slides available: https://goo.gl/77dwl5
!!# Plot.ly vs Chart.js
The two realistic contenders for charts in Tiki, without an external dependency (like R) are:
|| Criteria | Plot.ly | Chart.js
Can be included in newsletters | Yes? [https://plot.ly/javascript/static-image-export/|Image export] | Would require ((Converting dynamic JavaScript content into static assets)) Actually [https://www.codeproject.com/Tips/1120045/Export-Chart-js-Charts-as-Image|not so complicated] for ChartJS.
Can be included in mPDF | [https://sourceforge.net/p/tikiwiki/code/61246|Already done for raster image export] ([https://github.com/ropensci/plotly/issues/903#issuecomment-287117340|native pdf export isn't in the OSS version ]) | Would work with same solution as for newsletters
Client javascript Size | heavy %%% (plotly-latest.min.js is 760k)| lightweight %%% (vendor_bundled/vendor/chartjs/Chart.js/Chart.min.js is 150k)
Popularity | Good | Most popular
Diversity of charts | Most | Good
Technology | Built on top of [http://d3js.org/|d3.js] and [http://stack.gl/|stack.gl] | [https://www.w3schools.com/html/html5_canvas.asp|Canvas]
||
Note that in both case, using them server side is [https://community.plot.ly/t/how-to-perform-server-side-manipulation-using-plotly-js/1077|pretty heavy], might be an issue on shared hosting.
See also:
https://www.openhub.net/p/_compare?project_0=Chart-js&project_1=plotly.js
http://www.chartjs.org/docs/latest/notes/comparison.html
https://blog.sicara.com/compare-best-javascript-chart-libraries-2017-89fbe8cb112d#66bc
https://source.opennews.org/articles/what-i-learned-recreating-one-chart-using-24-tools/
!!# Related pages
* dev: ((Data Visualization))
* doc: ((doc:Visualization))
Alias names for this page:
(alias(DatavisConvergence))
;)
;)
;)
;)