Tiki has a few ways (ideas!) to visualize data. See also: Datavis Convergence
Bugs and Wishes
Open or Pending bugs and wishes tagged against the feature category "Charts and Data Visualization"
Create Item
Current features and Ideas
|
|
Plugins:
- PluginChart, the first one, from spreadsheet data
- PluginChartJS, added in Tiki16, if someone is able to make ti work
- PluginPivotTable, added in Tiki16.2, and it can make some charts types also
- PluginR also allows displaying graphs from data, through many of the packages for display and visualization of data: Lattice, ggplot2, gmaps, googleVIS (Google Visualization API), rCharts (PolyCharts), ...
- PluginDBreport, which could be transformed to charts & graphs
|
Some key libraries
Kibana
Grafana
d3.js
Plotly.js
- Built on top of d3.js and stack.gl, plotly.js is a high-level, declarative charting library. plotly.js ships with 20 chart types, including 3D charts, statistical graphs, and SVG maps.
- Plotly.js (MIT licensed):
https://plot.ly/javascript/open-source-announcement/
pivottable.js
MIT-licensed!
Vega
Related
Other Related links
Also:
- Flare: http://flare.prefuse.org
A priori desestimated because:
- It uses Flash, it can be used with free compilers (like the Free Flex SDK), and it produces impressive graphs. But we don't have anyone in the community using it right now, so it looks as if it would be too hard to maintain.
- it seems that the issue with visualization is not with the rendering engine as much as with gathering the data at this time (2011). For the rendering part, Raphael as used in sheets does a very good job.
- some tiki devs would prefer to use some non-flash solution, e.g. something like http://thejit.org/ or the Raphael lib to visualise data in Tiki
- flash animations are cool but it is too proprietary and problematic to code in an open source manner and make it accessible for everyone (you know, flash is not on iOS devices, requires 3rd party plugin in the browser, is cpu/memory resources intensive, etc.
When to use which type of chart
Source: https://www.facebook.com/photo.php?fbid=10154694517068373&set=a.48564688372.72440.692068372&type=3&theater
Examples
Recent features - PluginChartJS
Showcase PluginChartJS
Recent features - Plotly in PluginPivotTable
Showcase some of the promising charting features of Plotly through PluginPivotTable AND include one example with data to demonstrate the Boxplot chart with highlighting of user items or group items belonging to the user.
Other features - Spreadsheet charts
Showcase some of the (weak) charting capabilities in current Spreadsheets feature (see Spreadsheet demo for the time being)
Other features - PluginGDGraph
Showcase also PluginGdGraph
Former features - PluginChart
Currently broken since years ago
See PluginChart
Other features - PluginGoogleChart
Showcase also PluginGoogleChart
alias
Tiki has a few ways (ideas!) to visualize data. See also: ((Datavis Convergence))
{maketoc title="" levels="2,3"}
!! Bugs and Wishes
Open or Pending bugs and wishes tagged against the feature category "Charts and Data Visualization"
{LIST()}
{filter content="5" field="tracker_id"}
{filter field="tracker_status" content="o OR p"}
{filter field="tracker_field_category" content="326"}
{sort mode="modification_date_ndesc"}
{OUTPUT(template="table")}
{column field="mod_date" label="LastModif" mode="raw"}
{column field="tracker_status" label="" mode="raw"}
{column sort="tracker_field_resolution_status" field="tracker_field_resolution_status" label="Resolution Status" mode="raw"}
{column sort="tracker_field_submitted_by" field="tracker_field_submitted_by" label="Submitted By"}
{column field="tracker_field_assigned_to" label="Volunteered" mode="raw"}
{column field="tracker_field_subject" label="Title" mode="raw"}
{column label="Category" field="category" mode="raw"}
{column sort="tracker_field_version" field="tracker_field_version" label="Version" mode="raw"}
{column field="tracker_field_feature" label="Feature" mode="raw"}
{column sort="tracker_field_importance" field="tracker_field_importance" label="Importance" mode="raw"}
{tablesorter server="n" sortable="y"}
{OUTPUT}
{FORMAT(name="mod_date")}{display name="modification_date" format="date"}{FORMAT}
{FORMAT(name="tracker_status")}{display name="tracker_status" format="trackerrender"}{FORMAT}
{FORMAT(name="tracker_field_resolution_status")}{display name="tracker_field_resolution_status" default="" format="trackerrender" editable=inline}{FORMAT}
{FORMAT(name="tracker_field_submitted_by")}{display name="tracker_field_submitted_by" format="trackerrender"}{FORMAT}
{FORMAT(name="tracker_field_assigned_to")}{display name="tracker_field_assigned_to" format="trackerrender" editable=inline default=""}{FORMAT}
{FORMAT(name="tracker_field_subject")}{display name="tracker_field_subject" format="trackerrender"}{FORMAT}
{FORMAT(name="category")}{display name="tracker_field_category" format="trackerrender"}{FORMAT}
{FORMAT(name="tracker_field_version")}{display name="tracker_field_version" format="trackerrender"}{FORMAT}
{FORMAT(name="tracker_field_feature")}{display name="tracker_field_feature" format="trackerrender"}{FORMAT}
{FORMAT(name="tracker_field_importance")}{display name="tracker_field_importance" format="trackerrender" default="" editable=inline}{FORMAT}
{LIST}
{button href="Make+a+wish" _text="Create Item" _icon_name="create" _type="link" _class="create_item_button"}
---
!! Current features and Ideas
{SPLIT()}
* ((Timeline))
* ((Collaborative Image manipulation))
* ((Animations))
* ((WebGL))
* ((Wiki 3D))
* ((Sequence Diagram))
* ((Spreadsheet)) generates graphs
* ((Drawing))
* ((Visual Mapping)) (includes Topic Maps, Flowchart, Mind Maps and Concept Maps)
* ((Tags|Tag Cloud))
* ((OrgChart))
* ((doc:Action log)): graph report of ((doc:Contribution))s (size and types), better with external mod installed.
---
Plugins:
* ((doc:PluginChart)), the first one, from spreadsheet data
* ((doc:PluginChartJS)), added in ((doc:Tiki16)), if someone is able to make ti work {sign user="xavi" datetime="2017-01-27T11:52:46+00:00"}
* ((doc:PluginPivotTable)), added in ((doc:Tiki16.2)), and it can make some charts types also
* ((doc:PluginR)) also allows displaying graphs from data, through many of the packages for display and visualization of data: Lattice, ggplot2, gmaps, googleVIS (Google Visualization API), rCharts (PolyCharts), ...
* ((doc:PluginDBreport)), which could be transformed to charts & graphs
{SPLIT}
!! Some key libraries
!!! Kibana
{HTML()}<script type="text/javascript" src="https://www.ohloh.net/p/603211/widgets/project_factoids_stats.js"></script>{HTML}
!!! Grafana
{HTML()}<script type='text/javascript' src='https://www.openhub.net/p/grafana/widgets/project_factoids_stats?format=js'></script>{HTML}
!!! d3.js
* [http://d3js.org/|Data-Driven Documents]
{HTML()}<script type="text/javascript" src="https://www.openhub.net/p/718952/widgets/project_factoids_stats.js"></script>{HTML}
* https://github.com/search?o=desc&q=d3&s=stars&type=Repositories&utf8=%E2%9C%93
* http://christopheviau.com/d3list/gallery.html
* [https://github.com/mbostock/d3/wiki/Gallery|D3.js demos]
* http://nvd3.org/
* http://misoproject.com/d3-chart/
* http://dimplejs.org/
* http://weblog.bocoup.com/reusability-with-d3/
* http://c3js.org/
* http://bost.ocks.org/mike/chart/
* http://bost.ocks.org/mike/
* http://bl.ocksplorer.org/
* http://bl.ocks.org/
!!! Plotly.js
* Built on top of d3.js and stack.gl, plotly.js is a high-level, declarative charting library. plotly.js ships with 20 chart types, including 3D charts, statistical graphs, and SVG maps.
* Plotly.js (MIT licensed):
+ https://plot.ly/javascript/open-source-announcement/
{HTML()}<script type='text/javascript' src='https://www.openhub.net/p/plotly_js/widgets/project_factoids_stats?format=js'></script>{HTML}
!!! pivottable.js
MIT-licensed!
* https://www.openhub.net/p/pivottable
* https://github.com/nicolaskruchten/pivottable
!!! Vega
* https://vega.github.io/vega/examples/
{HTML()}
<script type='text/javascript' src='https://www.openhub.net/p/Vega-Visualization-Grammar/widgets/project_factoids_stats?format=js'></script>
{HTML}
{HTML()}
<script type="text/javascript" src="https://www.openhub.net/p/654100/widgets/project_factoids_stats.js"></script>
{HTML}
{HTML()}
<script type='text/javascript' src='https://www.openhub.net/p/AngularJS-FlowChart/widgets/project_factoids_stats?format=js'></script>
{HTML}
{HTML()}
<script type='text/javascript' src='https://www.openhub.net/p/cytoscape/widgets/project_factoids_stats?format=js'></script>
{HTML}
{HTML()}
<script type='text/javascript' src='https://www.openhub.net/p/PykCharts/widgets/project_factoids_stats?format=js'></script>
{HTML}
{HTML()}
<script type='text/javascript' src='https://www.openhub.net/p/flot/widgets/project_factoids_stats?format=js'></script>
{HTML}
{HTML()}
<script type='text/javascript' src='https://www.openhub.net/p/chartist-js/widgets/project_factoids_stats?format=js'></script>
{HTML}
{HTML()}
<script type='text/javascript' src='https://www.openhub.net/p/uvCharts/widgets/project_factoids_stats?format=js'></script>
{HTML}
!! Related
* ((Report))
* ((Decision))
* ((Spreadsheet))
* ((Visual Programming))
* ((Business Intelligence))
* ((Math))
* ((Maps Visualization))
* ((Datavis Convergence))
!!! Other Related links
* https://openvisconf.com/2016/#videos
* http://selection.datavisualization.ch/
* http://kraskniga.blogspot.ca/2012/06/comparison-of-javascript-data.html
* http://socr.ucla.edu/htmls/HTML5/https://github.com/RamyElkest/SocrMotionChartsHTML5/blob/gh-pages/README.md
**
* http://jster.net/category/visualization-libraries
* [http://thejit.org/|http://thejit.org/|box] (Wow!)
* http://jsplumb.org/jquery/demo.html
* http://www.jointjs.com/demos
* [http://sourceforge.net/projects/phplot/|http://sourceforge.net/projects/phplot/|box] (recently changed to LGPL)
* ((Raphael)) [http://raphaeljs.com/|http://raphaeljs.com/|box] (MIT license)
* http://www.simile-widgets.org/exhibit3/
* http://teethgrinder.co.uk/open-flash-chart-2/
* http://www.jqplot.com/ (GPL/MIT)
* http://www.graphviz.org/Gallery.php
* http://atlas.media.mit.edu/app/treemap/export/usa/2009/
* http://processingjs.org/
* http://ezcomponents.org/docs/api/latest/introduction_Graph.html
* http://teethgrinder.co.uk/open-flash-chart-2/ (version 2 is LGPL)
* http://pchart.sourceforge.net
* http://omnipotent.net/jquery.sparkline/
* https://github.com/idflood/ThreeNodes.js
* http://sigmajs.org/
* http://www.oesmith.co.uk/morris.js/
* http://www.flotcharts.org/ JavaScript plotting for jQuery
* http://misoproject.com/
* http://www.elasticsearch.org/2011/05/13/data-visualization-with-elasticsearch-and-protovis/
* http://kraskniga.blogspot.ca/2012/06/comparison-of-javascript-data.html
* http://www.rgraph.net/
* https://www.ohloh.net/p/compare?project_0=Rapha%C3%ABl&project_1=JSGL+-+JavaScript+Graphics+Library&project_2=protovis-js
* https://www.ohloh.net/p/compare?project_0=JavaScript+InfoVis+Toolkit&project_1=D3.js&project_2=NVD3.js
* http://www.chartjs.org/
* http://www.graphdracula.net/showcase/
* https://github.com/nicolaskruchten/pivottable
** https://www.openhub.net/p/pivottable
* https://opensource.com/life/15/6/eight-open-source-data-visualization-tools
* https://blog.jamesbayley.com/2013/02/01/a-review-of-javascript-drawing-libraries-for-flowcharts-gantt-charts-and-timelines/
Also:
* Flare: http://flare.prefuse.org
+ A priori desestimated because:
** It uses Flash, it can be used with free compilers (like the Free Flex SDK), and it produces impressive graphs. But we don't have anyone in the community using it right now, so it looks as if it would be too hard to maintain.
** it seems that the issue with visualization is not with the rendering engine as much as with gathering the data at this time (2011). For the rendering part, ((Raphael)) as used in sheets does a very good job.
** some tiki devs would prefer to use some non-flash solution, e.g. something like http://thejit.org/ or the Raphael lib to visualise data in Tiki
** flash animations are cool but it is too proprietary and problematic to code in an open source manner and make it accessible for everyone (you know, flash is not on iOS devices, requires 3rd party plugin in the browser, is cpu/memory resources intensive, etc.
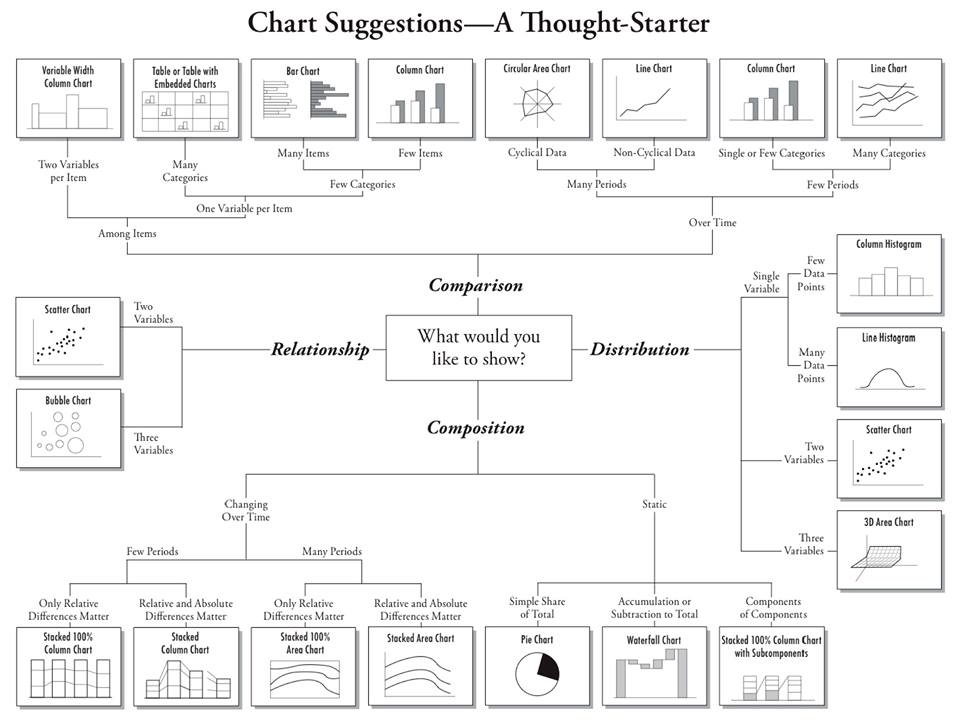
!! When to use which type of chart
{img type=fileId fileId=2196}
Source: https://www.facebook.com/photo.php?fbid=10154694517068373&set=a.48564688372.72440.692068372&type=3&theater
!! Examples
!!! Recent features - PluginChartJS
Showcase ((doc:PluginChartJS))
{CHARTJS(id="mychart1" type="pie" height="100" width="150" values="15:25:60" data_labels="foo:bar:wohoo" data_colors="red:pink:orange" data_highlights="snow:lightyellow:lightgrey")}{CHARTJS}
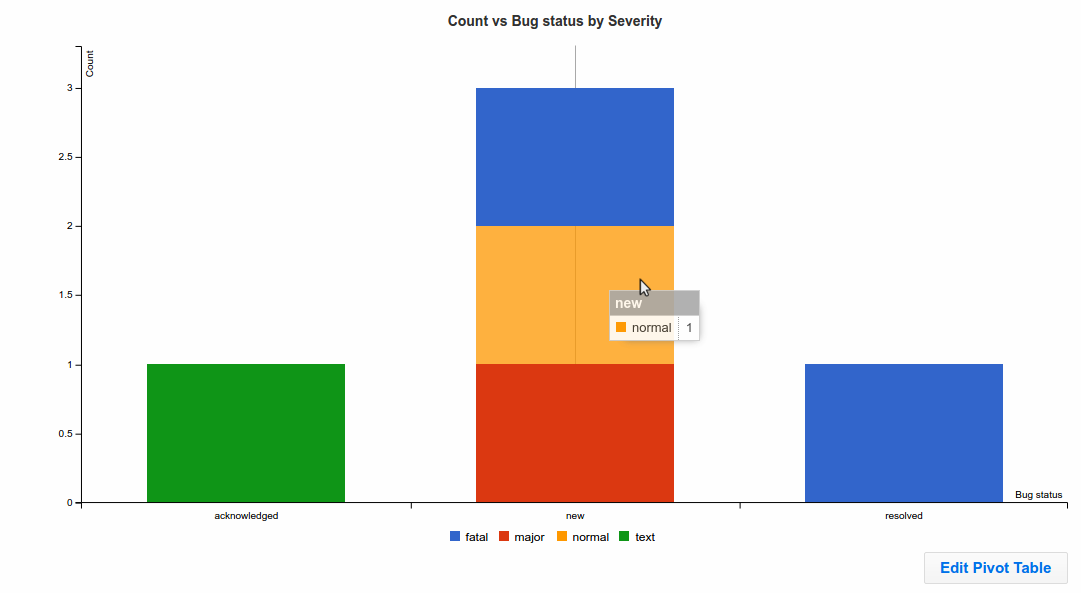
!!! Recent features - Plotly in PluginPivotTable
Showcase some of the promising charting features of Plotly through ((doc:PluginPivotTable)) AND include one example with data to demonstrate the Boxplot chart with highlighting of user items or group items belonging to the user.
{img src="https://doc.tiki.org/display1337"}
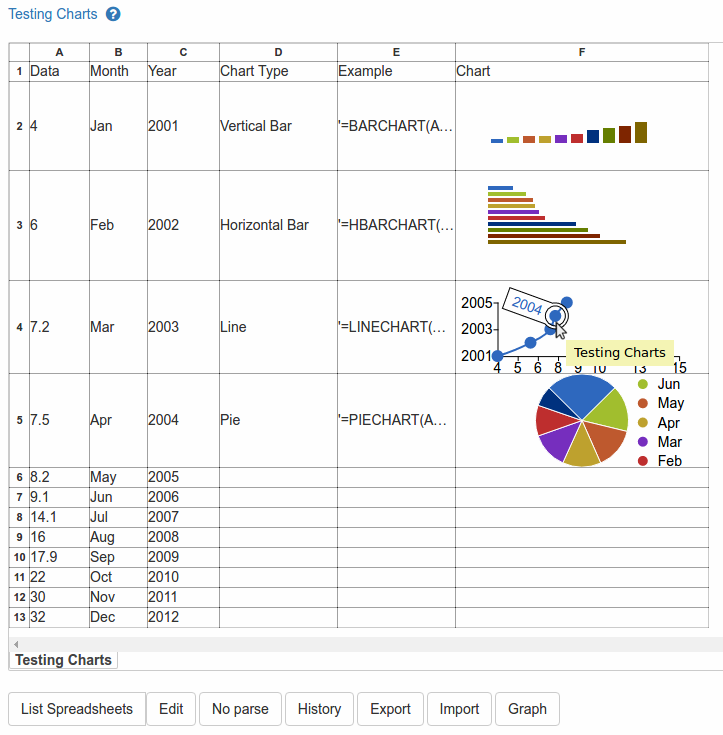
!!! Other features - Spreadsheet charts
Showcase some of the (weak) charting capabilities in current Spreadsheets feature (see ((pr:Spreadsheet demo)) for the time being)
{img src="https://tiki.org/display1159"}
!!! Other features - PluginGDGraph
Showcase also ((doc:PluginGdGraph))
{FLUIDGRID()}
{GDGRAPH(type="barvert" title="My Chart 1 - Vertical Bars" alttag="Test Chart with Vertical Bars" width="400" height="300")}1,5
2,7.8
3,1
4,19
5,6.5{GDGRAPH}
---
{GDGRAPH(type="barhoriz" title="My Chart 2 - Horizontal Bars" alttag="Test Chart with Horizontal Bars" width="400" height="300")}1,5
2,7.8
3,1
4,19
5,6.5{GDGRAPH}
{FLUIDGRID}
!!! Former features - PluginChart
Currently broken since years ago {sign user="xavidp" datetime="2017-08-05T09:31:29+00:00"}
See ((doc:PluginChart))
!!!! Other features - PluginGoogleChart
Showcase also ((doc:PluginGoogleChart))
-=alias=-
* (alias(graph)) | (alias(plot)) | (alias(chart)) | (alias(visualization)) | (alias(datavis))
;)
;)
;)
;)